
ASX ETO Report - May 2025
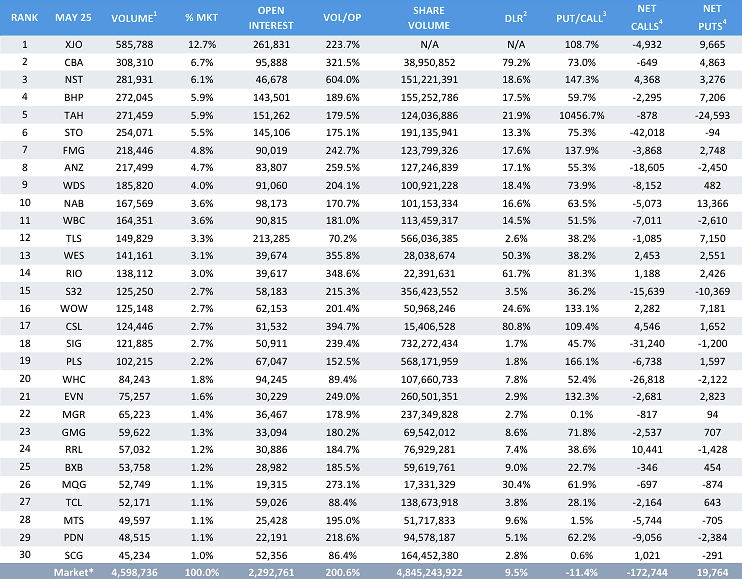
This report shows the top 30 most traded ETO Classes (Assets) for the corresponding month. This is the best indicator for option liquidity in the Austrialian Market.
What to analyse in this chart?
This report shows the top 30 most traded ETO Classes (Assets) for the corresponding month. This is the best indicator for option liquidity in the Austrialian Market.
Glossary:
Rank - Orders the ASX equities from 1-30 by number of contracts traded. Rank 1 is most traded ETO Class
Ticker - The underlying asset which the options are traded over
Volume - Total volume of that ETO class, excluding market makers
% Market - Of all the ETO's traded in the month, what fraction of the market were on that specific asset
Open Interest - The number of open contracts in the market at the end of the month.
Vol/OP - Open Interest devided by Volume, expressed as a percentage
Share Volume - Number of shares traded for the month for the underlying stock
DLR (Derivatives Liquidity Ratio) - options volume (in shares) devided by volume of underlying security
Put/Call - Put to Call ratio, expressed as a percentage
Net Calls - number of Call option contracts bought minus the number of options contracts sold, excluding Market Makers
Net Puts - number of Put option contracts bought minus the number of options contracts sold, excluding Market Makers
Use this as a reference to the most liquid underlyings, when considering opening new options positions. Frequent underlyings in the report are XJO, CBA, BHP, RIO, WDS, FMG, ANZ, NAB, TLS and WES
Looking for more ASX Options Insights, sent straight to your Inbox?